Introduction to Voilà, Part 2: A simple Performance Hack
7th May 2022Introduction
In my last post, I have presented a little interactive "dashboard" using Voilà, which illustrates the problem of overfitting. As a next step, I intend to deploy this dashboard using the cloud application platform herouku, which I have already used some time ago to deploy my first web project, a (static) Covid dashboard for Germany. Before doing so, however, I first wanted to increase the application's performance to ensure a good user experience.
Precomputing all models during startup
The whole "hack" boils down to exactly what the title of this section says: During startup, we now precompute and save all the different regressions trees which we wish to compare, instead of (re-)computing them every time the user selects a different model using the slider.
# Lists to store the trees in
# We place a generic object at list index 0,
# so that the list index equals the number of levels.
trees_nosplit = [object()]
trees_split = [object()]

for k in range(1,16):
    # Tree trained on the complete dataset
    regr = DecisionTreeRegressor(max_depth=k)
    regr.fit(x, y)
    trees_nosplit.append(regr)

    # Tree trained on the training dataset
    regr = DecisionTreeRegressor(max_depth=k)
    regr.fit(x_train, y_train)
    trees_split.append(regr)
If the slider is changed, the appropriate model is then simply loaded:
def plottingfunction(k):
    # Load precomputed model from list
    regr = trees_nosplit[int(k)]

    # Plot input data
    fig, ax = pt.singleplot()
    pt.oligoscatter(ax, x, y, c="C0", label="Data")

    # Plot model prediction
    x_pred = np.arange(0.0, 10, 0.01)[:, np.newaxis]
    y_pred = regr.predict(x_pred)

    # Beautify plot a bit
    pt.majorline(ax, X_pred, y_pred, color="cornflowerblue", label="Prediction")
    pt.labels(ax, "$x$", "$y$")
    pt.legend(ax)
    pt.ticklabelsize(ax)
    pt.despine(ax)

k_slider = widgets.FloatSlider(value=1, min=1, max=15, step=1)

interact(plottingfunction, k = k_slider);
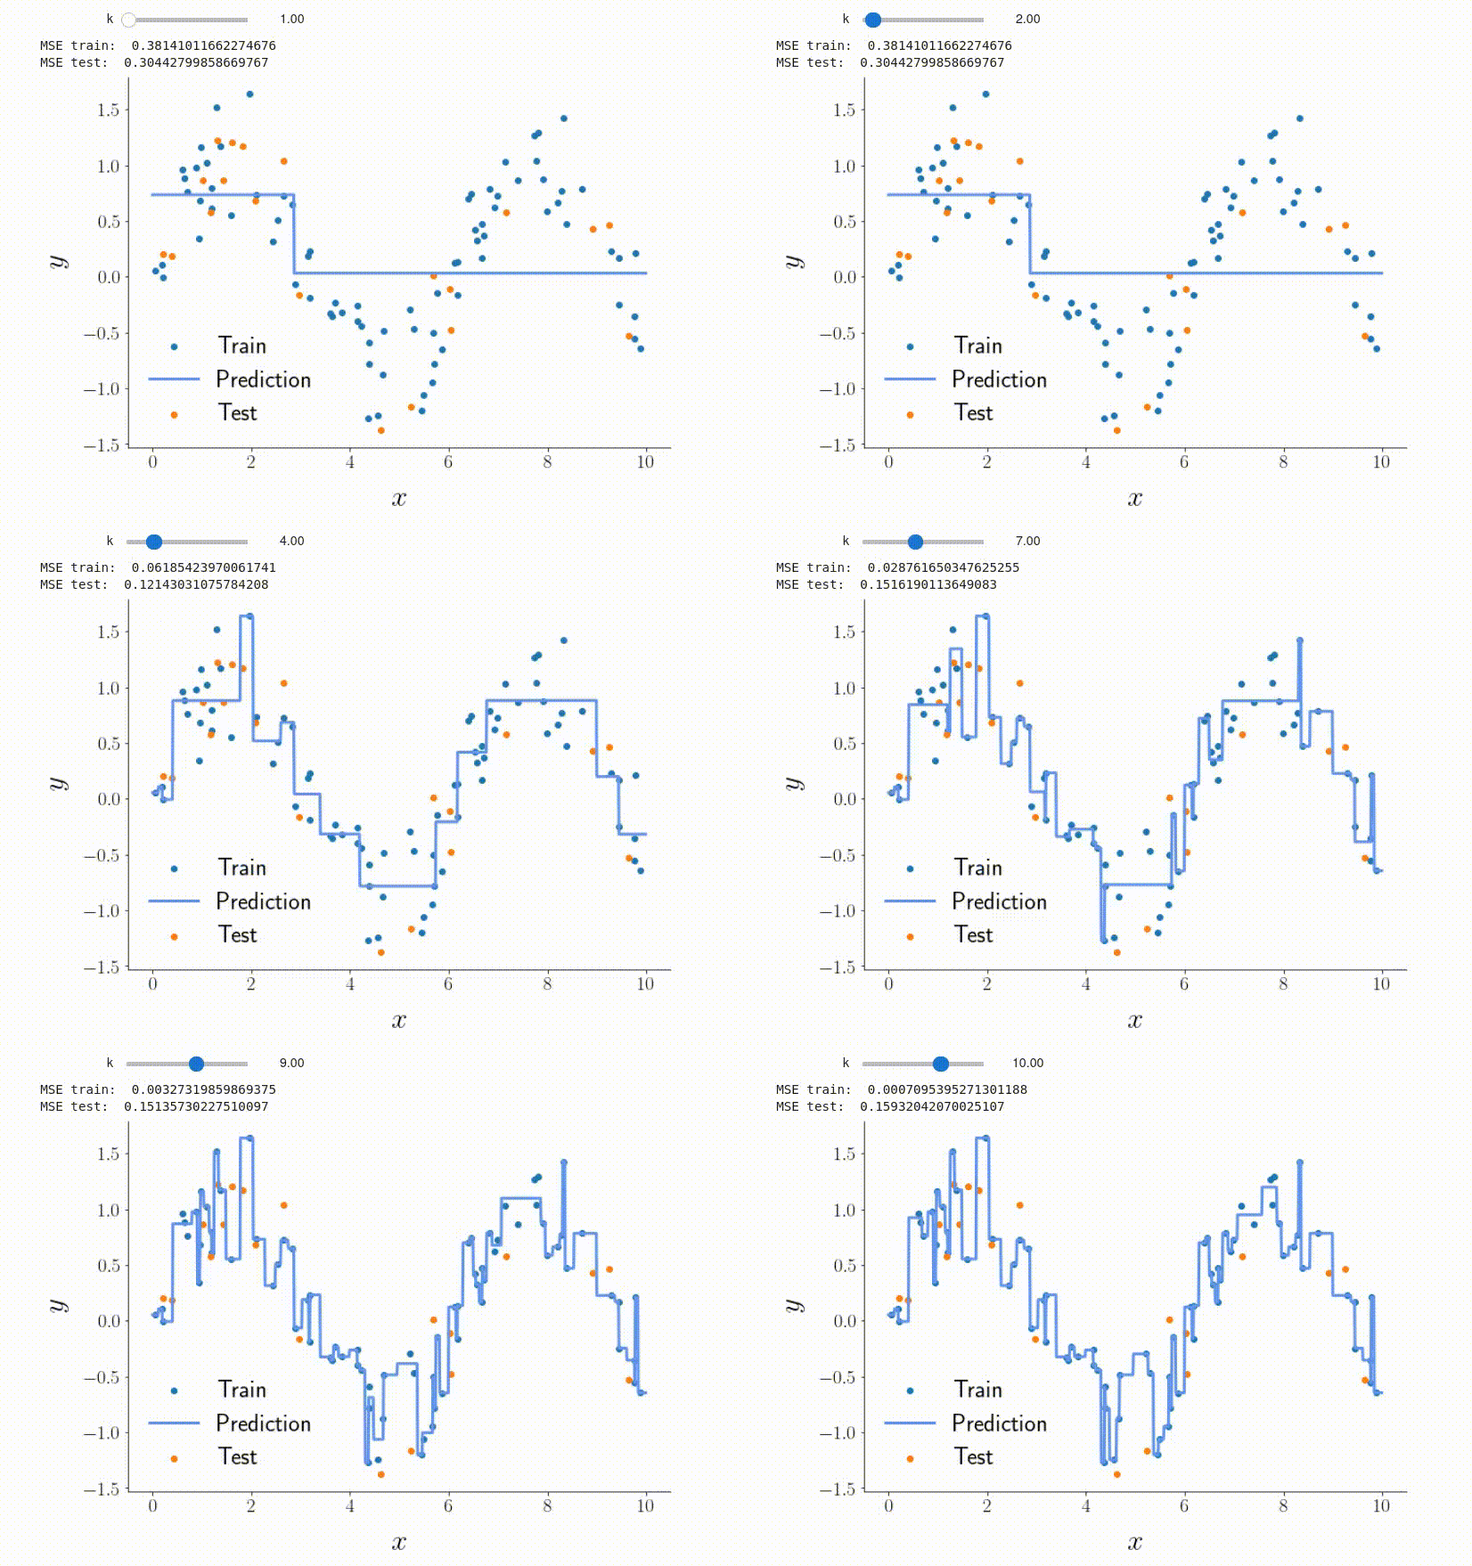
If you look at the GIFs in the previous post, you can actually see that the diagrams tend to take quite a bit of time to react (approximately on the order of one to two seconds). This is now not the case anymore:

Since this optimisation only comes with a barely noticeable increase in startup time, it's definitely worth doing.
Conclusions
With significantly increased performance, we are now ready to deploy the app to heroku. As soon as I have done so, I'll write up the exact process (and any potential pitfalls) for future reference in another post. Stay tuned :) !