Yet Another Covid Dashboard, Part 1: A Web App using Flask
Posted: 1st January 2022Preface and Overview
Without doubt, data visualisation and data presentation are extremely important parts of data science. If findings aren't visualised understandably and presented in a way that makes it easy to come to actionable conclusions, then these findings itself will not be of any real-world use.
While I would argue that I am pretty good at visualising data in an effective and aesthetically pleasing way, my presentations until now exclusively consisted of typical powerpoint (or rather: LaTeX) slide decks. For research group seminars and academic conferences, such presentations are are an appropriate choice; however, I recently started to want to also get into other ways of presenting data. A typical choice would be a so-called dashboard. Wikipedia defines a dashboard as
a type of graphical user interface which often provides at-a-glance views of key performance indicators (KPIs) relevant to a particular objective or business process.
In this blog post, I will present my very first dashboard, written as a web app in Python using the flask library. Thematically, we will present data on current Covid cases, on the current Covid strains/variants, on the state of the vaccination campaign, and on the number of available and occupied intensive care beds, all of those specific to the country of Germany. The data will be polled in the background, processed, turned into plots, and these plots are then finally placed into an HTML file which is exposed to the web.
The final results will look like this
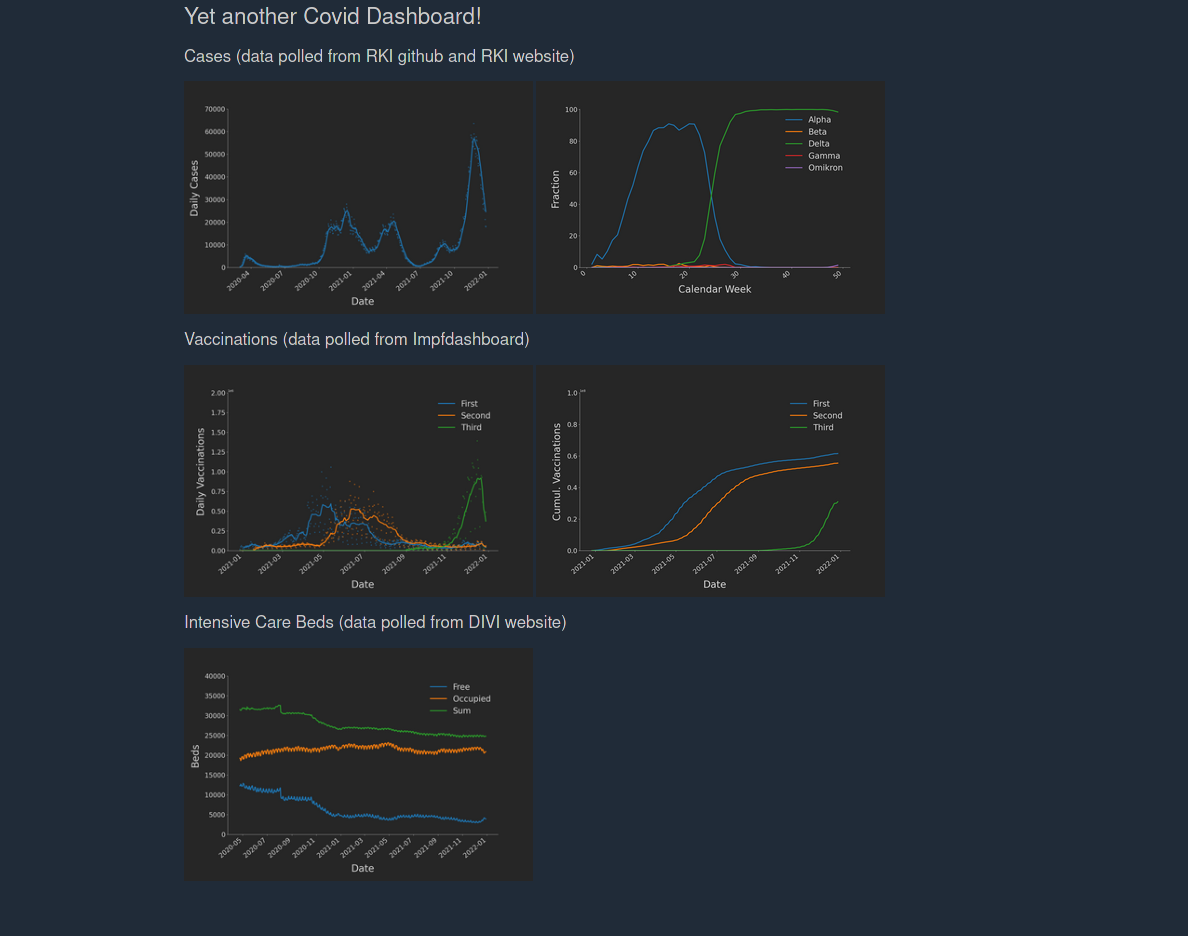
and can be found on my github.
Fetching the Data
First, we need to fetch the raw data we want to present. These are:
- The number of daily Covid cases in Germany. Can be downloaded as a CSV file from this github repo by the Robert-Koch-Institute (RKI).
- Data on the frequencies of the different Covid strains. Can be downloaded as an Excel table (yes, really) from the RKI here.
- Data on the progress of the vaccination campaing, which can be downloaded as TSV file from the German Impfdashboard page here.
- The number of free and occupied intensive care beds. These can be loaded as CSV from this subpage of the DIVI, which is a scientific society of German intensive and emergency care physicians.
Let's examine loading and working with these files more closely.
CSV and TSV Files
CSV and TSV files are easy to load from a web URL using the pandas library for Python. Just use the following command
df = pd.read_table(url, sep=",")
where url is a string containing the URL to the table to download, and sep contains the separator sign (depending on the file that's usually a comma or a semicolon or a tab). Now, df contains a pandas.DataFrame object with the file's data.
Excel Files
The data on the frequencies of the different Covid strains points to an Excel table. The site also uses some kind of mechanism to identify a direct download using pandas and will return a 403 Forbidden.
My first idea to circumvent the protection mechanism was to download the data to a temporary file using the requests library. However, a friend of mine suggested something more simple: We use the fsspec library instead, which gives us a file pointer to the remote file. This saves us from having to store the file locally, and we can directly parse the Excel file. Luckily, pandas provides a method for this, which saves us tons of work, as Excel files tend to be pretty annoying to work with. We only have to specify which of the individual sheets of the Excel file we want to store into our DataFrame. In this case, the sheet is called "VOC". Altogether, we run:
with fsspec.open(url) as fp:
    data = pd.read_excel(fp, sheet_name="VOC")
Some simple Preprocessing
Depending on the dataset, we want to do different things during the preprocessing steps. Instead of giving a complete tutorial on the whole project, I'll just mention some things I did and how exactly they can be done in Python.
- To help with plotting later, we want to convert the 'date' column of all the dataframes to a datetime data type, using a convenience method by pandas:
df['date'] = pd.to_datetime(df['date']). - For the vaccination data, only the numbers of cumulative doses were given. Thus, for any column
colname, we first have to calculate the daily differences, by usingdf.colname.diff(1). Then, in order to smooth the curves a bit, we calculate a running average with a period of seven days by usingdf["colname_mean] = data.rolling(window=7)[colname].mean(). The same command was also used to smooth the curves of the daily case data.
All the remaining steps of the preprocessing pipeline are simple Python / pandas operations that are not really worth explaining into detail here. For details, just check out the source code in the github repo of this project.
Generating the Plots
Plots are generated using the python library matplotlib. Or rather: the plots are generated using my own little plotting library, which wraps around matplotlib, applying some sensible, aesthetically pleasing default choices. A key point of generating the plots is to make sure to not use pyplot, because this would lead to the program retaining pointers to all generated plots. Thus, memory leaks would occur. Instead, generate a figure and the axes object as follows:
from matplotlib.figure import Figure
fig = Figure()
ax = fig.subplots()
Fiure size must be set manually using
fig.set_figheight(h)
fig.set_figwidth(w)
and to format an x-axis presenting dates we can use:
fig.autofmt_xdate(bottom=0.2, rotation=40, ha='right')
After having plotted the actual data, we now have to export the final plot to an base64 ASCII string which we can then place into the HTML of our dashboard. To do so, we run:
# Imports
import base64
from io import BytesIO

# First, we save the plot to a temporary buffer in memory.
buf = BytesIO()
fig.savefig(buf, format="png")

# Which we then encode in base64 bytes.
bytes = base64.b64encode(buf.getbuffer())

# Convert bytes to ASCII chars.
string = bytes.decode("ascii")
Serving the HTML with Flask
Now that we have produced all of our plots and converted them into base64-encoded ASCII strings, we only need to produce a HTML webpage which we can then expose to the web.
Making the HTML boils down to just concatenating some strings to produce a valid HTML file. The only thing worth mentioning is how we place the plots generated earlier into this HTML file. The simples approach is using the src parameter of the <img> tag as follows:
picture = f"<img width=500px, src='data:image/png;base64,{base64asciiplot}'/>"
After having assembled the HTML as a single string, we just need to set up flask to be able to serve the page to the web. This can be done using a few lines of code:
from flask import Flask

app = Flask(__name__)

@app.route("/")
def main():
    return assemble_dashboard()
This instructs Flask to serve the return value of assemble_dashboard() (i.e. the HTML string we prepared) to all (web) accesses to the route path "/".
As a last step, we now just have to run the flask app by running the following snippet in the console:
export FLASK_APP=yacd
flask run
The first line defines an environmen variable which names the app to run, and the second one starts up flask. The app can then be accessed under 127.0.0.1:5000/
Conclusion and Outlook
Writing this app was surprisingly easy. Until now, however, it only works locally, because I still have to find out how exactly I can run it on the webspace I currently own. In fact, this actually seems to be the hardest part of the whole project ;-D. Another thing I want to do even before thinking about deploying this app is implementing a caching mechanism to avoid sending out too many requests and to speed up the loading of the page.
P.S.
Happy new year, everybody!